
- Home
- Companies
- ION Science Ltd.
- News
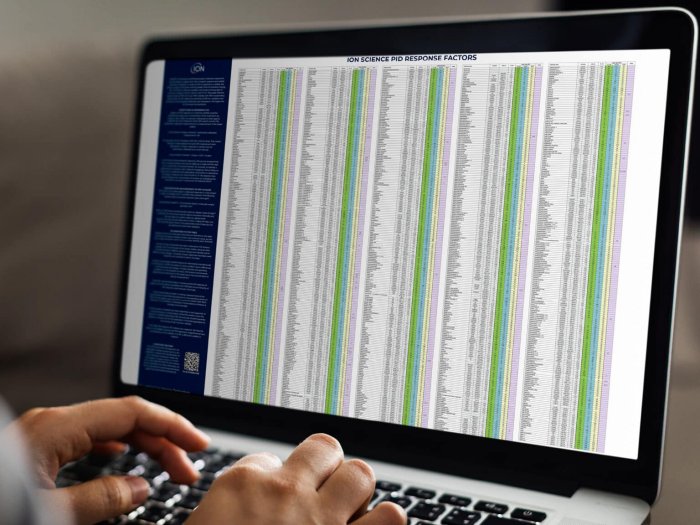
- ION Science PID Response Factor Chart
ION Science PID Response Factor Chart
Isobutylene serves as the reference gas for calibration. While ideally, the PID would be calibrated using a low concentration of the target chemical in air, this is often impractical. Therefore, isobutylene is used for calibration, and an RF is employed to convert the isobutylene-calibrated measurement to the target volatile’s concentration:
Concentration of target chemical = Isobutylene calibrated measurement x RF
For instance, if the RF for anisole is 0.59 with a 10.6 eV lamp, a 10 ppm response to anisole from an isobutylene-calibrated unit would indicate a concentration of anisole as 10 ppm x 0.59 = 5.9 ppm.
ION Science PIDs have pre-programmed RFs in a compound library, allowing users to select the target compound, calibrate with isobutylene, and obtain direct concentration readings.
The chart includes RFs for important chemicals, listed by their common names, but CAS numbers are recommended for precise identification. RFs are guideline figures, subject to variation based on PID design and operating conditions. ION Science advises calibrating the instrument to the target gas at the desired measurement concentration for accuracy.
Conversion between ppm and mg/m3 is facilitated by the equation:
Concentration (mg/m3) = Concentration (ppm) x Molecular weight (g/mole) / 24.5. The PID automatically handles this conversion in mg/m3 display mode.
Users should exercise caution in measuring PID responses at high or low concentrations, considering non-linearity, sensor clear-down time, and potential contamination of the PID window. Frequent calibration or bump tests are recommended, especially for less common volatiles. RFs labeled as ‘ZR’ indicate zero response, and ‘NA’ signifies an unavailable or insignificant value at toxic concentrations.
The RFs of many chemicals have been measured at ION Science typically with 10 and 50 ppm of the target volatile, using ten PIDs containing lamps of different photon energy and intensity and of different sensor designs. Generally, 50 ppm responses have been used. These RFs are indicated in bold in the chart.