
Refine by
Pollution Modeling Articles & Analysis
114 news found
This work contributes to Environment Agency research on the thermal transport of air pollution from regulated industries.RIVM presented results from a study comparing eight widely used atmospheric dispersion and deposition models, including ADMS, against local-scale ammonia and NOx deposition. ...
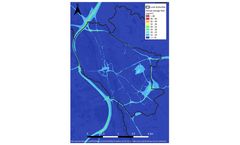
As part of their Air Quality Strategy, Oxfordshire County Council have released their report describing the generation of data for assessing the health impacts and associated financial costs of air pollution. The impacts were calculated using a combination of CERC's ADMS-Urban model and University of Birmingham's Air Quality Lifecourse Assessment Tool (AQ-LAT). ...

Historically, utilities detected blockages only after a problem had already manifested, such as a customer report of flooding or a pollution alarm. This reactive model left companies “blind” to the early stages of restriction build-up and meant that many incidents were only managed after negative impacts had occurred. ...

CERC is proud to announce the launch of Clean Air Routes London, a free interactive map developed by Westminster City Council (WCC) and supported by Defra, designed to help people navigate London using routes with the best available air quality. Launched on World Car Free Day, the tool encourages people to walk or cycle while avoiding areas with high pollution levels. By entering a start and end ...
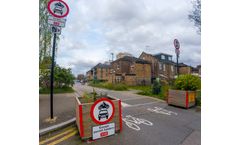
CERC consultants are carrying out air quality modelling to calculate the health impact of changes in air pollution due to the introduction of Low Traffic Neighbourhoods (LTNs) across four London boroughs. ...
Due to the unique forms of these standards – which are based on annual distributions of daily maximum hourly concentrations as opposed to the distribution of all hourly values – the AERMOD air dispersion model had to be updated to perform calculations accordingly. Nearly 15 years later, AERMOD continues to perform both NAAQS and non-NAAQS calculation methods. ...
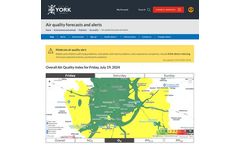
City of York Council commissioned CERC to develop an air quality forecasting and alert service to give York residents advance warning of when air pollution is expected to be higher than usual, up to 3 days ahead. The service provides daily air quality forecast maps at 5 metre resolution and zone-based air quality, pollen, UV and temperature forecasts. Residents can sign up to receive free air ...
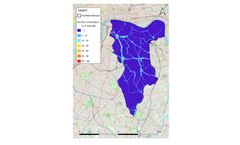
Southwark Borough Council commissioned CERC consultants to assess the contribution of bus emissions to total pollutant concentrations in Southwark. Using the ADMS-Urban model and emissions inventory tool EMIT, we created air quality maps of the borough for nitrogen dioxide and particulates, based on all emissions and then on bus emissions only. We also ...

CERC is a partner for a PhD studentship harnessing data and air pollution modelling to examine the complex interactions between pollution, climate, and health. The PhD project will delve into the issue of why the public is perceiving a decline in their health and wellbeing due to exposure to air pollutants when, in reality, ...
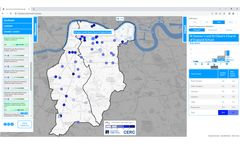
CERC has developed a digital air pollution impact tool to model the impacts of changes to air pollution sources and the adoption of mitigation measures, on levels of air pollution exposure. ...
The 2022 annual report focusses on air pollution, discussing the effects of air pollution on health, reporting progress made in improving air quality over recent decades, and highlighting possibilities for achievable solutions for continuing improvement. It includes discussion of both outdoor and indoor air pollution and gives suggestions for ...

Standard reports enable users to better understand the performance of their Zephyr® network, the current air quality, investigate changes in pollution concentrations and trends, evidence compliance with regulatory limits, and view how well their intervention strategies are working. ...
Compliance with the directive means data from the model is suitable for assessment purposes by local and central governments for public policy decisions to improve air quality and minimise the health implications of pollution exposure. ...
Models involved in the intercomparison exercise are: the air quality model included in the Met Office's Unified Model (AQUM), UKCEH's application of the European Monitoring and Evaluation Programme EMEP MSC-W model, Imperial College's CMAQ-Urban model, in addition to Ricardo's Pollution Climate ...

Pollution is a huge problem all around the world but you will find different kinds of pollution. ...
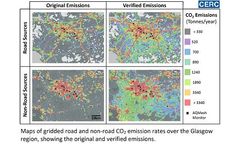
Researchers from CERC, Cambridge University, and ACOEM have collaborated on a project to verify CO2 emissions across greater Glasgow by combining measurements and CERC's ADMS-Urban air pollution dispersion model. The ongoing study, using available traffic data and emissions factors, suggests that CO2 emissions from road traffic around the region could be ...
However, compared to general air pollution modelling there are particular challenges associated with modelling odour dispersion and exposure due to the importance of odour variations over short timescales to the perceived nuisance. CERC's consultancy team, with Estonian, Latvian and Lithuanian Environment (ELLE) has carried out a Review of ...

This conference series is part of an initiative aimed at harmonising dispersion modelling for regulatory purposes. James O'Neill will present work on the development and evaluation of a model for pollutant dispersion from elevated roads. ...

The Breathe London map now shows how different polluting activities contribute to the concentration of nitrogen oxides at Breathe London sensor locations across the city. Just search for or click on any sensor. CERC modelled pollution sources across London for 2019 using our ADMS-Urban software to quantify the contributions from twenty source ...
One challenge of this work was to develop an emissions inventory for this megacity; model predictions have been compared to air quality measurements recorded during the NERC-funded project: 'An Integrated Study of AIR Pollution PROcesses in Beijing (AIRPRO)'. The figures show period-average measurements overlaid on modelled ...