


- Home
- Companies
- Nanosurf AG
- Products
- NaioAFM - Atomic Force Microscope (AFM) ...
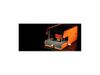
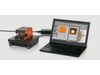
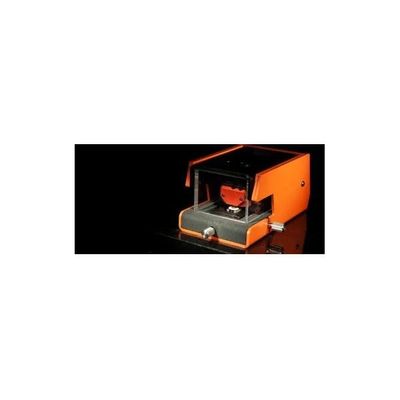
NaioAFM - Atomic Force Microscope (AFM) for Nanoeducation
The NaioAFM is the ideal atomic force microscope for nanoeducation and basic research on small samples. This all-in-one AFM system provides solid performance and easy handling, with a price tag and footprint that fit anyone and any place. "For several years we have used the Easyscan 2 and the NaioAFM to provide AFM training, for student research projects, and for demonstrations. These AFMs have provided us with years of exceptional use. They have allowed students to acquire complex skill sets associated with AFM imaging with great ease. The efficient design of the AFM hardware and the user-friendly software has been ideal for students enrolled in our semester-long AFM course. In addition to high-quality instrumentation, Nanosurf scientists have provided us with fast and outstanding service. I highly recommend using Nanosurf AFMs for educational, training, and research purposes."
- All-in-one plug-and-play AFM system
- Famously easy to use
- All standard operating modes available
AFM phase image of a polymer blend
This is an example of AFM phase imaging of a polymer blend performed on a NaioAFM. The polymer blend consists of polystyrene (PS) and polybutadiene (PB) deposited on silicon. PS forms islands within the PB matrix.
Topography analysis of ePTFE membrane using AFM
The abbreviation ePTFE stands for expanded polytetrafluorethylene, also known as expanded Teflon. The mechanical and medical properties of the material depend strongly on how the Teflon was expanded (mono- or bi-axially) and on the resulting ePTFE network structures. Due to its inert properties inside a human body, ePTFE is often used as an implant material. The empty spaces inside the network structure encourage the growth of soft tissue into such implants, which helps hold the implant in place quickly. There are many different ways to expand PTFE, all leading to different network structures. It is therefore very important to verify that the desired ePTFE structure was obtained after the expansion process.
In this application, we analyzed an ePTFE membrane using AFM. The topography image recorded clearly shows the intricate network structure of the sample. The length of the fibers and the size-distribution of the knots can conveniently be analyzed using the measurement tools integrated in the Nanosurf control software.
Compared to the conventional method used for this analysis - SEM imaging, where a gold film must first be evaporated onto the ePTFE sample in vacuum to make it conductive - AFM is much faster and easier to perform. With the AFM, ePTFE can be measured directly, without any prior treatment of the sample. Additionally, and in contrast to the SEM data, the AFM topographs actually contain quantitative depth information.
AFM force spectroscopy on a polymer blend
AFM-based force spectroscopy was used to characterize a polymer blend consisting of polystyrene (PS) and polybutadiene (PB). Data analysis or an array of force distance curves revealed differences in the material properties of the two components.
3D topography of the PS-PB blend overlaid with the stiffness map derived from the force-distance curves recorded on the same area. The DMT model was used to derive the sample stiffness from the force distance curves.
- Data processing: SPIP and Gwyddion
- Cantilever: PPP-NCSTR
- Image size: 15 µm
- Stiffness range: 4 GPa (log scale)
3D topography of the PS-PB blend overlaid with the adhesion map derived from the force-distance curves recorded on the same area.
- Data processing: SPIP and Gwyddion
- Cantilever: PPP-NCSTR
- Image size: 15 µm
- Max. adhesion force range: 20-40 nN
Example force-distance curves from different areas of the investigated PS-PB blend. The top and bottom panels show force-distance curves recorded on PB (top) and PS (bottom), respectively. The arrows in the topography image in the middle panel indicate the location where the force-distance curves were recorded. As indicated in the top panel, different information can be extracted from a force-distance curve: slope of the contact region, sample indentiation, max. adhesion force, and the work required for detachment. The slope itself a rough estimate of the sample stiffness, i.e. the PB is much softer than PS because the slope of the contact part is shallower (see red triangles). Analysis of the force distance curve using a contact mechanics model, such as the DMT model, reveals the actual stiffness of the sample.